10 November, 2017

Understanding SQL Execution Cycle

A normal SQL statement go through below phase before producing results.

1) PARSE PHASE
Parsing stage will tell what does the statement mean and how best to run it
There are two type of parses:
a) Soft Parse
  • check syntax, semantics and permissions
  • search the library cache for matching statement
If it finds the statement in library cache then it will not do the hard parse.
b) Hard Parse
  • also called optimization step
  • necessary on first execution
  • take parse locks on referenced object
  • develop a decision tree of possible plans
  • select the lowest cost plan for execution
  • store the plan in the library cache of the shared pool
Important: hard parse takes time!
GENERAL GOAL : PARSE ONCE AND EXECUTE MANY TIMES


2) BIND PHASE
This phase explain any variables to be used by SQL
  • not necessary if the statement uses no variables
  • retrieves values for variables from the user process
  • usually occurs after parsing
  • make possible re-use of existing optimized code
  • exception – first execution will “peek” the binds
  • Different binds may warrant different execution plans — can be tackled by adaptive cursor sharing


3) EXECUTE PHASE
This phase works in buffer cache
  • Most of the work for DML occurs here
  • shared locks on tables and exclusive locks on rows are taken
  • generate redo – write change vectors to the log buffer
  • write changes to the buffer cache by generating Undo OR writing new values to the table and index blocks
Data I/O during Execution phase can be:
a) Logical I/O
search the buffer cache for necessary data blocks and get it
Latch is light weight lock which is required to access Logical I/O. So logical I/O is not free. REMEMBER that Latches and Locks reduce scalability.
b) Physical I/O
copy blocks of table, index and undo segments into cache cause Physical I/O and it is costly operation.
 
 
4) FETCH PHASE
This phase prepare and return the result set.
  • Most of the work for SELECT occurs here
  • I/O from disk into memory if required
  • Search the buffer cache for required data blocks or do direct/indirect reads.
        Direct Reads: Copy Blocks into PGA. It is private area to user so no latch/lock contention
        Indirect Reads: Copy Blocks into Buffer Cache.  It is a shared area so latches will come into play.
  • Performs join,aggregation (group by), projections, sorts (order by)
  • return the result set to the user process

Create SQL Baseline for SQL_ID

Sometime DBAs need to create SQL Baseline for particular SQL_ID for plan stabilization
1) VERIFY CURRENTLY EXISTING SQL PLAN BASELINES
select * from dba_sql_plan_baselines;

2) CREATE ‘SQL TUNING SET’
A SQL tuning set (STS) is a database object that includes one or more SQL statements along with their execution statistics and execution context, and could include a user priority ranking. You can load SQL statements into a SQL tuning set from different SQL sources, such as AWR, the shared SQL area, or customized SQL provided by the user. An STS includes:
– A set of SQL statements
– Associated execution context, such as user schema, application module name and action, list of bind values, and the cursor compilation environment
– Associated basic execution statistics, such as elapsed time, CPU time, buffer gets, disk reads, rows processed, cursor fetches, the number of executions, the number of complete executions, optimizer cost, and the command type.
– Associated execution plans and row source statistics for each SQL statement (optional).
SQL> begin
 DBMS_SQLTUNE.CREATE_SQLSET(SQLSET_NAME => 'atfz4c63at1k1_STS01', DESCRIPTION => 'TEST SQL TUNE SET');
 END;
 /

PL/SQL procedure successfully completed.

3) VERIFY SQL MONITORING IS ENABLED FOR SQL STATEMENTS
SQL> SELECT DBMS_SQLTUNE.report_sql_monitor(type => 'TEXT', report_level=>'ALL', SQL_ID=>'atfz4c63at1k1') AS REPORT FROM DUAL;

REPORT
 --------------------------------------------------------------------------------
 SQL Monitoring Report

4) LOCATE AWR SNAPSHOT REQUIRED TO POPULATE THE ‘SQL TUNING SET’
select snap_id,begin_interval_time, end_interval_time from dba_hist_snapshot order by end_interval_time desc;

5) POPULATE ‘SQL TUNING SET’
A) FROM AWR
DECLARE
 CUR SYS_REFCURSOR;
 BEGIN
 OPEN CUR FOR
 SELECT VALUE(P) FROM TABLE ( DBMS_SQLTUNE.SELECT_WORKLOAD_REPOSITORY(BEGIN_SNAP=>1939, END_SNAP=>1940, BASIC_FILTER=> 'sql_id = ''atfz4c63at1k1''', ATTRIBUTE_LIST=>'ALL' )) p;
 DBMS_SQLTUNE.LOAD_SQLSET(SQLSET_NAME=> 'atfz4c63at1k1_STS01', POPULATE_CURSOR=>CUR);
 CLOSE CUR;
 END;
 /
*** OR **
B) FROM SHARED SQL AREA
DECLARE
 CUR SYS_REFCURSOR;
 BEGIN
 OPEN CUR FOR
 SELECT VALUE(P) FROM TABLE (DBMS_SQLTUNE.SELECT_CURSOR_CACHE('sql_id = ''atfz4c63at1k1''')) p;
 DBMS_SQLTUNE.LOAD_SQLSET(SQLSET_NAME=> 'atfz4c63at1k1_STS01', POPULATE_CURSOR=>CUR);
 CLOSE CUR;
 END;
 /

6) LIST OUT SQL TUNING SET TO VERIFY CONTENT
SELECT * FROM TABLE(DBMS_SQLTUNE.SELECT_SQLSET(SQLSET_NAME => 'atfz4c63at1k1_STS01'));

7) LOAD DESIRED PLAN FROM ‘SQL TUNING SET’ AS SQL PLAN BASELINE
DECLARE
 MY_PLANS PLS_INTEGER;
 BEGIN
 MY_PLANS := DBMS_SPM.LOAD_PLANS_FROM_SQLSET(SQLSET_NAME=>'atfz4c63at1k1_STS01', BASIC_FILTER=> 'PLAN_HASH_VALUE= ''3811430562''' );
 END;
 /

8) VERIFY IF SQL PLAN BASELINE GOT CREATED SUCCESSFULLY
select * from dba_sql_plan_baselines;

Automatic Workload Repository (AWR) Basics

The Automatic Workload Repository (AWR) automatically persists the cumulative and delta values for most of the statistics at all levels except the session level.
This process is repeated on a regular time period and the result is called an AWR snapshot. The delta values captured by the snapshot represent the changes for each statistic over the time period.
The Automatic Workload Repository (AWR) collects, processes, and maintains performance statistics for problem detection and self-tuning purposes. This data is both in memory and stored in the database.
Concept of STATISTICS_LEVEL Parameter:
Gathering database statistics using the AWR is enabled by default and is controlled by the STATISTICS_LEVEL initialization parameter. The STATISTICS_LEVEL parameter should be set to the TYPICAL or ALL to enable statistics gathering by the AWR. The default setting is TYPICAL. Setting STATISTICS_LEVEL to BASIC disables many Oracle Database features, including the AWR, and is not recommended.
SQL> show parameter STATISTICS_LEVEL
NAME                                 TYPE        VALUE
------------------------------------ ----------- ------------------------------
statistics_level                     string      TYPICAL

Concept of Snapshots
Snapshots are sets of historical data for specific time periods that are used for performance comparisons by ADDM.
By default, Oracle Database automatically generates snapshots of the performance data once every hour and retains the statistics in the workload repository for 8 days.

Managing Snapshots
OEM is easy to use tool for managing snapshots but if you don’t use OEM then go for below manual ways.

A) Creating Snapshots:
You can manually create snapshots with the CREATE_SNAPSHOT procedure to capture statistics at times different than those of the automatically generated snapshots. For example:
BEGIN
DBMS_WORKLOAD_REPOSITORY.CREATE_SNAPSHOT ();
END;
/
B) Dropping Snapshots
You can drop a range of snapshots using the DROP_SNAPSHOT_RANGE procedure. To view a list of the snapshot IDs along with database IDs, check the DBA_HIST_SNAPSHOT view. For example, you can drop the following range of snapshots:
BEGIN
DBMS_WORKLOAD_REPOSITORY.DROP_SNAPSHOT_RANGE (low_snap_id => 22, high_snap_id => 32, dbid => 3310949047);
END;
/
Active Session History data (ASH) that belongs to the time period specified by the snapshot range is also purged when the DROP_SNAPSHOT_RANGE procedure is called.
C) Modifying Snapshot Settings

You can adjust the interval, retention, and captured Top SQL of snapshot generation for a specified database ID, but note that this can affect the precision of the Oracle Database diagnostic tools.
The INTERVAL setting affects how often the database automatically generates snapshots. The RETENTION setting affects how long the database stores snapshots in the workload repository. The TOPNSQL setting affects the number of Top SQL to flush for each SQL criteria (Elapsed Time, CPU Time, Parse Calls, sharable Memory, and Version Count). The value for this setting is not affected by the statistics/flush level and will override the system default behavior for the AWR SQL collection. It is possible to set the value for this setting to MAXIMUM to capture the complete set of SQL in the shared SQL area, though by doing so (or by setting the value to a very high number) may lead to possible space and performance issues because there will more data to collect and store. To adjust the settings, use the MODIFY_SNAPSHOT_SETTINGS procedure. For example:
BEGIN
DBMS_WORKLOAD_REPOSITORY.MODIFY_SNAPSHOT_SETTINGS( retention => 43200, interval => 30, topnsql => 100, dbid => 3310949047);
END;
/


Concept of Baselines
A baseline contains performance data from a specific time period that is preserved for comparison with other similar workload periods when performance problems occur. The snapshots contained in a baseline are excluded from the automatic AWR purging process and are retained indefinitely.
There are several types of available baselines in Oracle Database:
■ Fixed Baselines
A fixed baseline corresponds to a fixed, contiguous time period in the past
■ Moving Window Baseline
A moving window baseline corresponds to all AWR data that exists within the AWR retention period. Oracle Database automatically maintains a system-defined moving window baseline. The default window size for the system-defined moving window baseline is the current AWR retention period, which by default is 8 days
■ Baseline Templates
You can also create baselines for a contiguous time period in the future using baseline templates. There are two types of baseline templates: single and repeating.
You can use a single baseline template to create a baseline for a single contiguous time period in the future.
You can use a repeating baseline template to create and drop baselines based on a repeating time schedule. This is useful if you want Oracle Database to automatically capture a contiguous time period on an ongoing basis.

Managing the Baselines

A) Creating a Baseline
1.Review the existing snapshots in the DBA_HIST_SNAPSHOT view to determine the range of snapshots to use.
2.Use the CREATE_BASELINE procedure to create a baseline using the desired range of snapshots:
BEGIN
DBMS_WORKLOAD_REPOSITORY.CREATE_BASELINE (start_snap_id => 270,
end_snap_id => 280, baseline_name => 'peak baseline',
dbid => 3310949047, expiration => 30);
END;
/

B) Dropping a Baseline
Periodically, you may want to drop a baseline that is no longer used to conserve disk space. The snapshots associated with a baseline are retained indefinitely until you explicitly drop the baseline or the baseline has expired.
To drop a baseline:
1.Review the existing baselines in the DBA_HIST_BASELINE view to determine the baseline to drop.
2.Use the DROP_BASELINE procedure to drop the desired baseline:
BEGIN
DBMS_WORKLOAD_REPOSITORY.DROP_BASELINE (baseline_name => 'peak baseline',
cascade => FALSE, dbid => 3310949047);
END;
/
In the example, the name of baseline is peak baseline. The cascade parameter is set to FALSE, which specifies that only the baseline is dropped. Setting this parameter to TRUE specifies that the drop operation will also remove the snapshots associated with the baseline. The optional dbid parameter specifies the database. identifier, which in this example is 3310949047. If you do not specify a value for dbid, then the local database identifier is used as the default value.
C) Renaming a Baseline
To rename a baseline:
1.Review the existing baselines in the DBA_HIST_BASELINE view to determine the baseline to rename.
2.Use the RENAME_BASELINE procedure to rename the desired baseline:
BEGIN
DBMS_WORKLOAD_REPOSITORY.RENAME_BASELINE (
old_baseline_name => 'peak baseline',
new_baseline_name => 'peak mondays',
dbid => 3310949047);
END;
/
In this example, the name of the baseline is renamed from peak baseline, as specified by the old_baseline_name parameter, to peak mondays, as specified by the new_baseline_name parameter.

Generating Automatic Workload Repository Reports
1) Generating an AWR Report
At the SQL prompt, enter:
@$ORACLE_HOME/rdbms/admin/awrrpt.sql
Enter value for report_type: text or HTML
Enter value for num_days: 2
Enter value for begin_snap: 150
Enter value for end_snap: 160
Enter value for report_name:
Using the report name awrrpt_1_150_160
2) Generating an Oracle RAC AWR Report
The awrgrpt.sql SQL script generates an HTML or text report that displays statistics for a range of snapshot IDs using the current database identifier and all available database instances in an Oracle Real Application Clusters (Oracle RAC) environment.
At the SQL prompt, enter:
@$ORACLE_HOME/rdbms/admin/awrgrpt.sql
Enter value for report_type: text or HTML
Enter value for num_days: 2
Enter value for begin_snap: 150
Enter value for end_snap: 160
Enter value for report_name:
Using the report name awrrpt_rac_150_160.html
3) Generating an AWR Report on a Specific Database Instance
The awrrpti.sql SQL script generates an HTML or text report that displays statistics for a range of snapshot IDs using a specific database and instance. This script enables you to specify a database identifier and instance for which the AWR report will be generated.
@$ORACLE_HOME/rdbms/admin/awrrpti.sql
Enter value for report_type: text
A list of available database identifiers and instance numbers are displayed:
Instances in this Workload Repository schema
~~~~~~~~~~~~~~~~~~~~~~~~~~~~~~~~~~~~~~~~~~~~
DB Id Inst Num DB Name Instance Host
----------- -------- ------------ ------------ ------------
3309173529 1 MAIN main examp1690
3309173529 1 TINT251 tint251 samp251
Enter value for dbid: 3309173529
Enter value for inst_num: 1
Enter value for num_days: 2
Enter value for begin_snap: 150
Enter value for end_snap: 160
Enter value for report_name:
Using the report name awrrpt_1_150_160
4) Generating an Oracle RAC AWR Report on Specific Database Instances
The awrgrpti.sql SQL script generates an HTML or text report that displays statistics for a range of snapshot IDs using specific databases and instances running in an Oracle RAC environment.
@$ORACLE_HOME/rdbms/admin/awrgrpti.sql
Enter value for report_type: html
Enter value for dbid: 3309173529
Enter value for instance_numbers_or_all: 1,2
Enter value for num_days: 2
Enter value for begin_snap: 150
Enter value for end_snap: 160
Enter value for report_name:
Using the report name awrrpt_rac_150_160.html

5) Generating an AWR Report for a SQL Statement
The awrsqrpt.sql SQL script generates an HTML or text report that displays statistics of a particular SQL statement for a range of snapshot IDs. Run this report to inspect or debug the performance of a SQL statement.
@$ORACLE_HOME/rdbms/admin/awrsqrpt.sql
Enter value for report_type: html
Enter value for num_days: 1
Enter value for begin_snap: 146
Enter value for end_snap: 147
Specify the SQL ID of a particular SQL statement to display statistics:
Enter value for sql_id: 2b064ybzkwf1y
Enter value for report_name:
Using the report name awrrpt_1_146_147.html
6) Generating an AWR Report for a SQL Statement on a Specific Database Instance
The awrsqrpi.sql SQL script generates an HTML or text report that displays statistics of a particular SQL statement for a range of snapshot IDs using a specific database and instance.

@$ORACLE_HOME/rdbms/admin/awrsqrpi.sql
Enter value for report_type: html
Enter value for dbid: 3309173529
Using 3309173529 for database Id
Enter value for inst_num: 1
Using 1 for instance number
Enter value for num_days: 1
Enter value for begin_snap: 146
Enter value for end_snap: 147
Enter value for sql_id: 2b064ybzkwf1y
Enter value for report_name:
Using the report name awrrpt_1_146_147.html

Generating Automatic Workload Repository Compare Periods Reports
While an AWR report shows AWR data between two snapshots (or two points in time), the AWR Compare Periods report shows the difference between two periods (or two AWR reports, which equates to four snapshots). Using the AWR Compare Periods report helps you to identify detailed performance attributes and configuration settings that differ between two time periods.
For example, if the application workload is known to be stable between 10:00 p.m. and midnight every night, but the performance on a particular Thursday was poor between 10:00 p.m. and 11:00 p.m., generating an AWR Compare Periods report for Thursday from 10:00 p.m. to 11:00 p.m. and Wednesday from 10:00 p.m. to 11:00 p.m. should identify configuration settings, workload profile, and statistics that were different in these time periods. Based on the differences, you can more easily diagnose the cause of the performance degradation. The two time periods selected for the AWR Compare Periods Report can be of different durations because the report normalizes the statistics by the amount of time spent on the database for each time period, and presents statistical data ordered by the largest difference between the periods.
1) Generating an AWR Compare Periods Report
@$ORACLE_HOME/rdbms/admin/awrddrpt.sql
Enter value for report_type: html
Enter value for num_days: 2
Specify a beginning and ending snapshot ID for the first time period:
Enter value for begin_snap: 102
Enter value for end_snap: 103
Specify the number of days for which you want to list snapshot IDs in the second time period.
Enter value for num_days2: 1
Specify a beginning and ending snapshot ID for the second time period:
Enter value for begin_snap2: 126
Enter value for end_snap2: 127
Enter a report name, or accept the default report name:
Enter value for report_name:
Using the report name awrdiff_1_102_1_126.txt


2) Generating an Oracle RAC AWR Compare Periods Report

@$ORACLE_HOME/rdbms/admin/awrgdrpt.sql
Enter value for report_type: html
Enter value for num_days: 2
Specify a beginning and ending snapshot ID for the first time period:
Enter value for begin_snap: 102
Enter value for end_snap: 103
Specify the number of days for which you want to list snapshot IDs in the second time period.
Enter value for num_days2: 1
Specify a beginning and ending snapshot ID for the second time period:
Enter value for begin_snap2: 126
Enter value for end_snap2: 127
Enter a report name, or accept the default report name:
Enter value for report_name:
Using the report name awrracdiff_1st_1_2nd_1.html

3) Generating an AWR Compare Periods Report on a Specific Database Instance
@$ORACLE_HOME/rdbms/admin/awrddrpi.sql
Enter value for report_type: text

Instances in this Workload Repository schema
~~~~~~~~~~~~~~~~~~~~~~~~~~~~~~~~~~~~~~~~~~~~
DB Id Inst Num DB Name Instance Host
----------- -------- ------------ ------------ ------------
3309173529 1 ORA ORA1 examp1690
3309173529 1 ORA2 ORA251 samp251

Enter value for dbid: 3309173529
Using 3309173529 for Database Id for the first pair of snapshots
Enter value for inst_num: 1
Using 1 for Instance Number for the first pair of snapshots
Enter value for num_days: 2
Enter value for begin_snap: 102
Enter value for end_snap: 103
Enter value for dbid2: 3309173529
Using 3309173529 for Database Id for the second pair of snapshots
Enter value for inst_num2: 1
Using 1 for Instance Number for the second pair of snapshots
Enter value for num_days2: 1
Enter value for begin_snap2: 126
Enter value for end_snap2: 127
Enter value for report_name:
Using the report name awrdiff_1_102_1_126.txt

4) Generating an Oracle RAC AWR Compare Periods Report on Specific Database Instances
The awrgdrpi.sql SQL script generates an HTML or text report that compares detailed performance attributes and configuration settings between two selected time periods using specific databases and instances in an Oracle RAC environment.

@$ORACLE_HOME/rdbms/admin/awrgdrpi.sql
Enter value for report_type: html

Instances in this Workload Repository schema
~~~~~~~~~~~~~~~~~~~~~~~~~~~~~~~~~~~~~~~~~~~~
DB Id Inst Num DB Name Instance Host
----------- -------- ------------ ------------ ------------
3309173529 1 MAIN main examp1690
3309173529 1 ORA251 ORA251 samp251

Enter value for dbid: 3309173529
Using 3309173529 for Database Id for the first pair of snapshots
Enter value for inst_num: 1,2
Using instances 1 for the first pair of snapshots
Enter value for num_days: 2
Enter value for begin_snap: 102
Enter value for end_snap: 103

Instances in this Workload Repository schema
~~~~~~~~~~~~~~~~~~~~~~~~~~~~~~~~~~~~~~~~~~~~
DB Id Inst Num DB Name Instance Host
----------- -------- ------------ ------------ ------------
3309173529 1 MAIN main examp1690
3309173529 1 ORA251 ORA251 samp251
3309173529 2 ORA251 ORA252 samp252
Enter value for dbid2: 3309173529
Using 3309173529 for Database Id for the second pair of snapshots
Enter value for instance_numbers_or_all2: 3,4
Enter value for num_days2: 1
Specify a beginning and ending snapshot ID for the second time period:
Enter value for begin_snap2: 126
Enter value for end_snap2: 127
Enter value for report_name:
Using the report name awrracdiff_1st_1_2nd_1.html

Active Sessions History (ASH) Basics

The active session history (ASH) sampler performs the sampling. ASH samples the current state of all active sessions. The database collects this data into memory, where you can access it with a V$ view.
Using ASH enables you to examine and perform detailed analysis on both current data in the V$ACTIVE_SESSION_HISTORY view and historical data in the DBA_HIST_ACTIVE_SESS_HISTORY view, often avoiding the need to replay the workload to gather additional performance tracing information.
ASH also contains execution plan information for each captured SQL statement. You can use this information to identify which part of SQL execution contributed most to the SQL elapsed time. The data present in ASH can be rolled up on various dimensions that it captures, including the following:
■ SQL identifier of SQL statement
■ SQL plan identifier and hash value of the SQL plan used to execute the SQL statement
■ SQL execution plan information
■ Object number, file number, and block number
■ Wait event identifier and parameters
■ Session identifier and session serial number
■ Module and action name
■ Client identifier of the session
■ Service hash identifier
■ Consumer group identifier
You can gather ASH information over a specified duration into a report.

Generating an ASH Report
OEM is one great tool to generate the ASH report without any extra hassles. Below we have documented the manual way of generating ASH. The ashrpt.sql SQL script generates an HTML or text report that displays ASH information for a specified duration.
When it prompts you for begin time you can give an actual date, and time to the minute and second, or if you wanted to start from a begin time 20 minutes ago, just type -20 (yes, negative 20). And for duration give the number of minutes you want the report to cover, you can pick a couple of minutes before an incident and couple of minutes after the incident. Usually not try to go beyond 10-15 mins duration.
@$ORACLE_HOME/rdbms/admin/ashrpt.sql
Enter value for report_type: text
Specify the begin time in minutes before the system date:
Enter value for begin_time: -10
Enter the duration in minutes that the report for which you want to capture ASH information from the begin time.
Enter value for duration:
Enter a report name, or accept the default report name:
Enter value for report_name:
Using the report name ashrpt_1_0310_0131.txt

Generating an ASH Report on a Specific Database Instance
The ashrpti.sql SQL script generates an HTML or text report that displays ASH information for a specified duration for a specified database and instance.

Generating an Oracle RAC ASH Report
The ashrpti.sql SQL script generates an HTML or text report that displays ASH information for a specified duration for specified databases and instances in an Oracle RAC environment.
Once the report is generated, look for the below:
1. Average Active Sessions: the more this statistics the more your DB was busy. So usually if you see this in the several tens or hundreds then you have a problem!
2. Top User Events: this gives you an idea as to what the most waited on event was within the time span you ran the report for. The % Event gives you an idea as to how much a particular wait event contributed to the overall wait.
3. Top SQL Command Types: this will give you an idea of what operation was being run the most, usually UPDATE/DELETES etc may show you locks etc. So pay attention.
4. Top SQL with TOP Events: this is the main section that shows you the most expensive SQL for the time period in question along with their SQL ID and the database wait event that contributed to their latency.
There are other details, but these 4 above will give you a very quick idea on what slowed the database and these ASH reports are much less verbose than the AWR reports and more importantly, ASH is much more granular.
Once you have identified the SQL ID, you can delve deeper to look at the plan and maybe craft a solution to the problematic SQL.

EBS Database Parameter Settings Analyzer

All Oracle Apps DBA must have referred below Note id at least once in their career. Most of us refer it  during installation and upgrade of Oracle EBS
application to verify if we have right set if database parameters defined for the optimum performance of EBS application.
Database Initialization Parameters for Oracle E-Business Suite Release 12 (Doc ID 396009.1)
This document has all the required database parameters which are common to all the database release and which are required by EBS application. It also contains release specific database initialization parameters for different releases like 10g, 11g, 12c etc.
Above Note id was always very useful but it required a bit of manual work to compare all the parameters. Oracle has now created another Analyzer tool which makes it much easier to verify if you have the EBS required set of database parameters or not.
EBS Database Parameter Settings Analyzer (Doc ID 1953468.1)

Important points regarding this analyzer tool:
  • Just like so many other EBS analyzer, this analyzer tool can also be run as standalone SQL or run as concurrent program.
  • This is a non-invasive script – the Analyzer does not perform any INSERTs, UPDATEs or DELETEs to your data; it just reports on it so you can run safely on your production instance.
  • This analyzer script is fully compliant with the Historical DOC ID 396009.1. Actually this analyzer provides recommended value of database initialization parameter settings based on that note id only.
  • It provides many useful information like details of mandatory parameters which does not exists on your database or the parameter names which should be removed from your database.
  • The report is generated in an easy to read HTML format. Report will be named as db_param_analyzer.html and will get generated in same directory from where you executed it. If you run it via concurrent program then it will get saved in $APPLCSF/$APPLOUT.
  • This tool only requires one input parameter which is:  Number of possible active users. This parameter is Optional also. You can choose to enter the number of possible active users, or click “Enter” to skip. If you specify 0 or skip to enter this parameter, this script will get the number of active users from fnd_user table who have logged on EBS in last 30 days.
Running the Analyzer via SQL*Plus is a simple process
Example:
$ sqlplus apps/<apps_password>
SQL>@db_param_analyzer.sql
Enter the number of active users: <Enter the value>
For details on running it as concurrent program refer to Note ID 1953468.1

Sample Report
Below is how this report show up:


Change weblogic user password in EBS R12.2

EBS 12.2 uses WebLogic Server from Fusion Middleware 11g in place of OC4J 10g as part of the release’s internal technology stack.
Your organization’s security rule may demand changing password for important uerids at regular interval. This document describes the procedure to use if you need to change the password  of the Oracle WebLogic Server Administration user password at some time.
1. Log in to the Oracle WebLogic Server Administration console at http:// <server>.<domain>:<wls_admin_port>/console with the current user name and password.
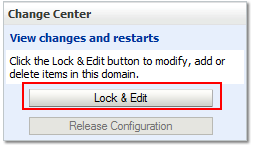
2. Choose the Lock and Edit button.1_Change_weblogic_users_password_EBS_R12.2
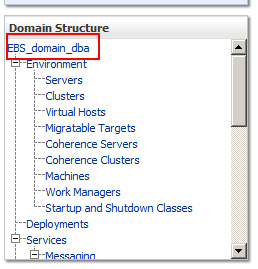
3. Select the ‘Domain’ link under the Domain Structure section.2_Change_weblogic_users_password_EBS_R12.2
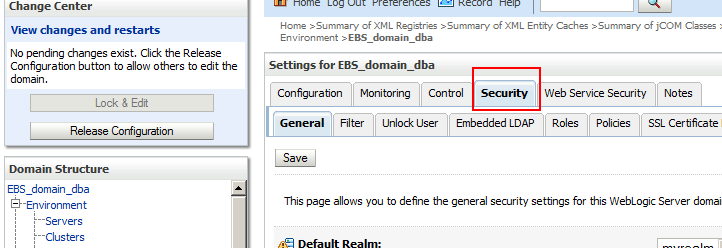
4. Select the Security tab.3_Change_weblogic_users_password_EBS_R12.2
5. Select Advanced.4_Change_weblogic_users_password_EBS_R12.2
6. Enter the new Node Manager/Weblogic password.5_Change_weblogic_users_password_EBS_R12.2
7. Choose the Save button and then the Activate Changes button.6_Change_weblogic_users_password_EBS_R12.27_Change_weblogic_users_password_EBS_R12.2
8. Choose the ‘Security Realms’ link on the Oracle E-Business Suite 12.2 domain configuration, and then select the ‘myrealm’ link.
9. Select the Users and Groups tab and choose the ‘weblogic’ link.
10. Select the Passwords tab and enter the same password you entered in Step 6.
11. Choose the Save button.
12. Back up these files and change password:Backup boot.properties files under the admin server and all managed servers.
$FMW_HOME/user_projects/domains/EBS_domain_<SID>/servers/AdminServer/security/boot.properties
$FMW_HOME/user_projects/domains/EBS_domain_<SID>/servers/formsc4ws_server1/data/nodemanager/boot.properties
$FMW_HOME/user_projects/domains/EBS_domain_<SID>/servers/forms_server1/data/nodemanager/boot.properties
$FMW_HOME/user_projects/domains/EBS_domain_<SID>/servers/oacore_server1/data/nodemanager/boot.properties
$FMW_HOME/user_projects/domains/EBS_domain_<ID>/servers/oafm_server1/data/nodemanager/boot.properties

Use a text editor to edit each of the above files and change the password to the new password.
Remember: Watch out if you mistakenly add any space/special character in the password.
Note: After the services are restarted in the next step, the password you entered will be obfuscated (not human readable).
13. Stop and restart all application tier servicesUse the adstpall.sh and adstrtall.sh scripts (.cmd command files on Windows)Ensure all services start successfully, and then test the Oracle WebLogic Server console login and Oracle E-Business Suite login.

ORACLE APPLICATIONS R12.2 LOG FILES

Below are some of the log file locations which DBAs may need to access quite frequently in R12.2.
Green color boxes indicates location where log files are.

log_1


log_2


log_3


log_4


log_5


Log files file Online patching (adop)
The adop log files are located on the non-editioned file system (fs_ne), under:
$NE_BASE/EBSapps/log/adop/<adop_session_id>/<phase>_<date>_<time>/<context_name>/log
This log directory will contain patch logs, patch worker logs and other patch related log files created for specific purposes
Also, some patch tasks may create separate log files in the same directory.
Online pathcing filesystem cloning process related log files are found under:
$INST_TOP/admin/log

Log files for Autoconfig process
On Applicaion Tier: $INST_TOP/admin/log/<MMDDhhmm>
On Database Tier: $ORACLE_HOME/appsutil/log/<CONTEXT_NAME>/<MMDDhhmm>


Log files for start/stop of services from $ADMIN_SCRIPTS_HOME
In below directory you will find log files related to start/stop process of oacore, forms, apache, opmn, weblogic admin server/node manager:
$LOG_HOME/appl/admin/log


Log/Out files for Concurrent programs/managers
The path is defined by same variables that we used earlier for 11i/R12.1 . Log/Out files are stored in Non-Editioned filesystem.
Log files: $APPLCSF/$APPLLOG (or $NE_BASE/inst/<CONTEXT_NAME>/logs/appl/conc/log)
Out files: $APPLCSF/$APPLOUT (or $NE_BASE/inst/<CONTEXT_NAME>/logs/appl/conc/out)


Log files for OPMN and OHS processes
Below directory contains log files related OPMN process(opmn.log), OPMN Debug logs(debug.log), HTTP Transaction logs (access.log), security settings related logs.
$IAS_ORACLE_HOME/instances/<ohs_instance>/diagnostics/logs


Log file for Weblogic Node Manager
Log file is generated by Node Manager and contains data for all domains that are controlled by Node Manager on a given physical machine.
$FMW_HOME/wlserver_10.3/common/nodemanager/nmHome1/nodemanager.log


Log file for Weblogic Oracle Management Service log file
Initial settings AdminServer and Domain level information is written in this log file
$EBS_DOMAIN_HOME/sysman/log


Log files for server processes initiated through Weblogic
Stdout and stderr messages generated by the server instance (server instnaces like forms, oafm, oacore etc) at NOTICE severity level or higher are written by Weblogic Node Manager to below directory.
$EBS_DOMAIN_HOME/servers/<server_name>/logs/<server_name>.out

Finding OPP Manager log for a concurrent request

=> Use below query to find the OPP manager log for a concurrent request.  SELECT fcpp.concurrent_request_id req_id, fcp.node_name, fcp.lo...